IELTS Writing Task 1: Everything You Need to Know
IELTS Writing Task 1 may be seen as the “easier” part of the Writing section, but it has its own challenges! In this task, you must describe, summarise or explain visual information, such as graphs, charts, tables, processes, or maps, using at least 150 words. The focus here is on describing, summarising, and explaining data logically, identifying key trends, and all using accurate academic language, without personal opinions.
Although IELTS Writing Task 1 is just as equally weighted as Task 2 for your overall writing band score, it is important to be familiar with the task format, sample answers and strategies to take your work to a new level.
In this blog, we will cover everything you need to know about IELTS Writing Task 1! The types of questions, the structure, common mistakes, and tips to improve your score!
Not Sure Where to
Start?
Speak with an
Expert and Get Clarity

Profile Evaluation & Eligibility
-
Target, Intakes & Deadlines
-
Scholarship and Loan Advice
IELTS Essay Writing Test Format 2025
The IELTS Writing section assesses your ability to communicate ideas clearly, make and develop arguments, and write using suitable academic language. The section is graded using a band scale of 0–9 and lasts 60 minutes total. You will complete two writing tasks: Task 1 (descriptive/analytical writing) and Task 2 (essay writing).
You will be graded on task achievement, cohesion and coherence, lexical resource, and grammatical range and accuracy.
|
Task |
Description |
Time Allotted |
Word Count (Recommended) |
|
Task 1 (Academic) |
Interpret and describe visual data such as charts, graphs, tables, or diagrams in your own words. |
20 minutes |
At least 150 words |
|
Task 1 (General Training) |
Write a formal, semi-formal, or informal letter in response to a given situation. |
20 minutes |
At least 150 words |
|
Task 2 (Both Academic & GT) |
Write an essay expressing your opinion, discussing a problem, or presenting an argument with supporting evidence. |
40 minutes |
At least 250 words |
Common IELTS Essay Topics for Writing Task 1 Practice
IELTS Academic Writing Task 1 will require you to describe visual information: charts, graphs, tables, and processes. Each question type requires a slightly different approach, whether this be identifying trends, making comparisons, or explaining stages. For IELTS Writing Task 1, you should practice to attempt this in a 20-minute time frame.
The following table gives the common IELTS Task 1 essay types and examples of each:
|
Task Type |
Description |
Example |
|
Line Graphs |
Represents changes or trends over time with one or multiple lines. |
The line graph shows the percentage of people aged 65 and over in Japan, Sweden, and the USA between 1940 and 2040. |
|
Bar Charts |
Displays data using vertical or horizontal bars, often for comparisons. |
The bar chart illustrates the number of students studying Computer Science in five different countries in 2010 and 2020. |
|
Pie Charts |
Shows proportions or percentages in a circular format. |
The pie charts compare the average household spending in the UK on various categories in 1970 and 2020. |
|
Tables |
Presents information in a tabular format for comparison. |
The table gives information about the monthly salaries of secondary school teachers in five countries in 2009. |
|
Processes |
Explains how something works or the stages of a process. |
The diagram shows the process of producing electricity from geothermal energy. |
|
Maps |
Illustrates geographical or structural changes over time. |
The maps show the changes made to a public park between 1980 and the present day. |
|
Combinations |
Combines two or more visual types (e.g., chart + table). |
The bar chart and table show the number of tourists visiting Australia from different countries and their average spending in 2010. |
|
Development |
Shows evolution or stages of growth over time. |
The diagram illustrates the development of a village into a small town between 1990 and 2015. |
IELTS Writing Task 1: Sample 1
Question: The graph below shows the oil production (in barrels) in several African countries from 2000 to 2004. Summarise the information by selecting and reporting the main features, and make comparisons where relevant. Write at least 150 words.
The graph below shows the oil production (in barrels) in several African countries from 2000 to 2004.
|
Countries |
2000 |
2001 |
2002 |
2003 |
2004 |
|
Nigeria |
2,000,000 |
2,100,000 |
1,900,000 |
2,100,000 |
2,200,000 |
|
Chad |
0 |
0 |
0 |
50,000 |
290,000 |
|
Congo Brazzaville |
280,000 |
270,000 |
250,000 |
235,000 |
205,000 |
|
Cote d’Ivoire |
8,000 |
7,000 |
15,000 |
25,000 |
45,000 |
Solution: The table compares the oil production in four different African countries, Nigeria, Chad, Congo Brazzaville, and Cote d’Ivoire, from 2000 to 2004.
Overall, it can be seen that Nigeria registered the highest oil production in all the years. Also, while the oil production in Chad and Cote d’Ivoire increased, it fell in Congo Brazzaville and fluctuated in Nigeria.
There was no oil production in Chad from 2000 to 2002. In 2003, Chad produced about 50,000 barrels, and this increased and reached 290,000 barrels in 2004. Similarly, Cote d’Ivoire’s production also increased from 8000 barrels in 2000 to 45,000 barrels by 2004. On the other hand, the production of oil in Congo Brazzaville decreased continuously. In 2000, 280,000 barrels of oil were produced in Congo, and its production fell by 10,000-20,000 barrels year by year and reaching 205,000 barrels in 2004.
Finally, oil production in Nigeria varied. In 2000, 2,000,000 barrels were produced, and this increased slightly to 2,100,000 by 2001. However, in the next year, production fell by 200,000 barrels. From 2002 onwards, production increased continuously and in 2004, a production of 2,200,000 barrels was recorded.
IELTS Essay on Education Writing Task 1: Sample 2
Question: The chart below shows the spending (in millions) by 18-20 year olds in one country on five different products in 2010 and 2014.
Summarise the information by selecting and reporting the main features, and make comparisons where relevant. Write at least 150 words.
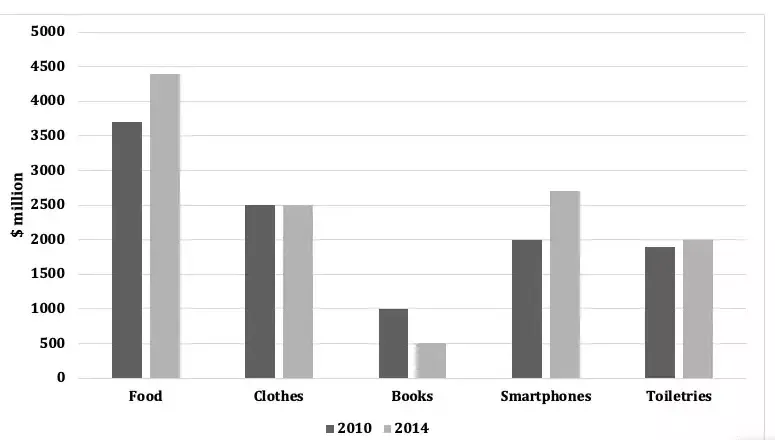
Solution: The bar graph compares the spending of 18-20-year-olds on food, clothes, books, smartphones, and toiletries in 2010 and 2014 in a particular country.
Overall, it can be seen that the spending on all the products except books and clothes rose with time. Furthermore, the maximum spending was done on food in both years.
In 2010, the 18-20-year-olds spent roughly 3700$ million on food, which was followed by clothes at about 2500$ million. Smartphones and toiletries accounted for about 2000$ million in spending each. The least expenditure was on books, with a figure of only $1000 million.
In the next four years, the expenditure on food, smartphones, and toiletries increased and in 2010, about $4300 million was spent on food, whereas about $2700 million was spent on smartphones. The amount spent on toiletries rose minimally by about $100 million. By contrast, the spending on books became nearly half. Lastly, the expense of clothes remained unchanged at $2500.
Top 10 Tips to Write Effectively in IELTS Writing Task 1
The IELTS Writing module commonly feels too hard for test takers, but you can do your best with planning and preparation. Here are 10 useful tips to help you prepare for a Band 9 score:
-
Understand the task completely: Interpretation errors count as lost marks.
-
Pay attention to word count: 150 words (Task 1) and 250 words (Task 2) are standards.
-
Use your time wisely: Balance time spent on planning, writing, and reviewing.
-
Structure is essential: Use introductory, body, and conclusion paragraphs.
-
Write logically, not lengthily: A short, concise, logical argument will score better than going off on a long tangent.
-
Make complete and accurate use of grammar: Misusing an infinitive, a sentence, or a period can cost you a band.
-
Use complete sentences: IELTS Writing tasks do not accept bullet points.
-
Answer plainly: There are no 'right' or 'wrong' answers - only an opinion backed up by facts.
-
Use the same spelling convention consistently: You can use any form of English you like, just don't mix spellings.
-
Practice as it will be: Practice writing for a time to ensure that you won't struggle in the exam.
IELTS Sample Papers for the Writing Section
Writing can often be the most challenging part of the exam, but with proper practice, it can become more manageable. Task 1 requires you to describe visual data, while Task 2 asks you to write an essay on a given topic. Both tasks assess your ability to organize ideas and present them effectively.
Take a look at the following sample papers to see how to approach each task.:
|
General |
Academic |
From the Desk of Yocket
The IELTS writing task emphasises the importance of clarity, good structure, and strong language skills. Key areas to focus on include time management, understanding the specific requirements of each task, and building a diverse vocabulary. Practising under test conditions is the most effective way to improve your IELTS score!
Yocket Prep provides comprehensive support, including guidance from expert tutors, writing feedback from a professional team, and personalised recommendations to help you successfully tackle the IELTS, all in one convenient platform.
Need the Ultimate Study Plan?
Consult with a Master Trainer for a custom roadmap to score high!
 1800-270-6088
'%3e%3cpath%20d='M11.6654%209.60799C11.5056%209.52809%2010.4669%209.04869%2010.3071%208.96879C10.1473%208.88889%209.98752%208.88889%209.82772%209.04869C9.66792%209.20849%209.34832%209.68789%209.18851%209.84769C9.10861%2010.0075%208.94881%2010.0075%208.78901%209.92759C8.22971%209.68789%207.67041%209.36829%207.19101%208.96879C6.79151%208.56929%206.39201%208.08989%206.07241%207.61049C5.99251%207.45069%206.07241%207.29089%206.15231%207.21099C6.23221%207.13109%206.31211%206.97129%206.47191%206.89139C6.55181%206.81149%206.63171%206.65169%206.63171%206.57178C6.71161%206.49188%206.71161%206.33209%206.63171%206.25219C6.55181%206.17229%206.15231%205.21348%205.99251%204.81398C5.91261%204.25468%205.75281%204.25468%205.59301%204.25468H5.19351C5.03371%204.25468%204.79401%204.41448%204.71411%204.49438C4.23471%204.97378%203.99501%205.53308%203.99501%206.17228C4.07491%206.89139%204.31461%207.61049%204.79401%208.24969C5.67291%209.52809%206.79151%2010.5668%208.14981%2011.206C8.54931%2011.3658%208.86891%2011.5256%209.26842%2011.6055C9.66792%2011.7653%2010.0674%2011.7653%2010.5468%2011.6854C11.1061%2011.6055%2011.5855%2011.206%2011.9051%2010.7266C12.0649%2010.407%2012.0649%2010.0874%2011.985%209.76779L11.6654%209.60799ZM13.6629%202.33708C10.5468%20-0.779026%205.51311%20-0.779026%202.397%202.33708C-0.1598%204.89388%20-0.639201%208.80899%201.1186%2011.9251L0%2016L4.23471%2014.8814C5.43321%2015.5206%206.71161%2015.8402%207.99001%2015.8402C12.3845%2015.8402%2015.9001%2012.3246%2015.9001%207.93009C15.98%205.85268%2015.1011%203.85518%2013.6629%202.33708ZM11.5056%2013.5231C10.4669%2014.1623%209.26841%2014.5618%207.99001%2014.5618C6.79151%2014.5618%205.67291%2014.2422%204.63421%2013.6829L4.39451%2013.5231L1.9176%2014.1623L2.5568%2011.7653L2.397%2011.5256C0.479401%208.32959%201.4382%204.33458%204.55431%202.33708C7.67041%200.339576%2011.6654%201.37828%2013.583%204.41448C15.5006%207.53059%2014.6217%2011.6055%2011.5056%2013.5231Z'%20fill='%232B3340'/%3e%3c/g%3e%3cdefs%3e%3cclipPath%20id='clip0_202_11837'%3e%3crect%20width='16'%20height='16'%20fill='white'/%3e%3c/clipPath%3e%3c/defs%3e%3c/svg%3e) +91 6366421078
+91 6366421078 support@yocket.in
 1st floor, Chandermukhi Building, Nariman Point, Mumbai, Maharashtra 400021
© 2026 Yocket Prep. All rights reserved.
GRE® is a registered trademark of Educational Testing Service (ETS). This website is not endorsed or approved by ETS.


